
 Chengdu GreenWater Co.,Ltd.
Home
Library
Technical Literature
Research and application of pure oxygen aeration in coking wastewater treatment system
Research and application of pure oxygen aeration in coking wastewater treatment system
1. Basis for project testing
This project is carried out in accordance with the "Technology Development Contract" signed by Chongqing Iron and Steel Co., Ltd. and Chengdu GreenWater Co.,Ltd. on the "Research and Application of Pure Oxygen Aeration Technology for Coking Wastewater Treatment Systems".
2. Contents of project testing
1. According to the agreement signed between Chongqing Iron and Steel Co., Ltd. Coking Plant and Chengdu Lushui Technology Development Co., Ltd. "Research and Application of Pure Oxygen Aeration Technology in Coking Wastewater Treatment System" "Technical Agreement", content of this project And the technical indicators are:
※Introduction of GWQ oxygen diffuser, which can be used without stopping water treatment operation Inspection and maintenance;
※Pure oxygen is used instead of air as the oxygen source for organic matter degradation;
※GWQ oxygen diffuser power efficiency: ≥4.63kg/kwh;
2. During the actual test process, in addition to the above content, the following qualitative observations were also added:
※Can dissolved oxygen be improved based on the existing air law?
※Can the current oxygen supply capacity of GWQ equipment meet the needs of processing the water volume of the entire system?
※Can using GWQ oxygen diffuser for pure oxygen aeration provide operational flexibility when the load fluctuates? Stable effluent water quality;
※Surface foam formation;
3. Description of project test process
1. Test equipment
The equipment used in this test consists of (1) oxygen diffusion equipment, (2) oxygen supply equipment, (3) It consists of oxygen control equipment, (4) oxygen supply pipeline and (5) equipment starting cabinet.
(1) Oxygen diffusion equipment
The oxygen diffusion equipment is one GWQ-O2-1200 diffuser and three GWQ-O2-400 diffusers. device. Its performance parameters under design conditions are shown in Table 1, and the test installation layout is shown in Figure 1.
| Model | Oxygenation capacity (kgO2/h) | oxygen transfer efficiency (%) | Power efficiency (kgO2/kw) | Installed power (kw) |
|---|---|---|---|---|
| GWQ-O2-1200 | 109 | ≥65 | 5.78 | 22 |
| GWQ-O2-400 | 30 | ≥70 | 5.20 | 7.5 |
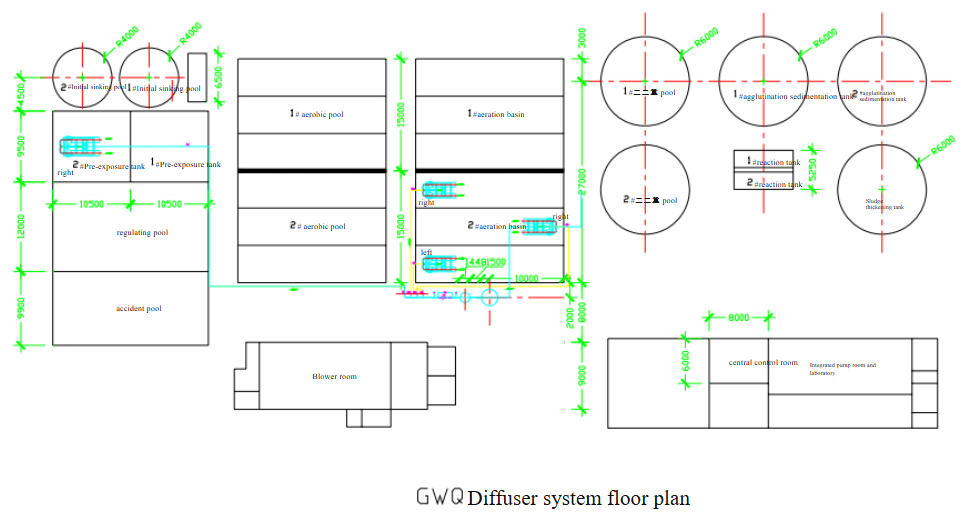
Diagram labels
- #Initial sinking pool
- #Initial sinking pool
- #二二重 pool
- #agglutination sedimentation tank
- #agglutination sedimentation tank
- # aerobic pool
- #aeration basin
- #reaction tank
- #Pre-exposure tank
- #Pre-exposure tank
- right
- #reaction tank
- #二二重 pool
- right
- Sludge thickening tank
- right
- #aeration basin
- # aerobic pool
- regulating pool
- left
- accident pool
- central control room
- Integrated pump room and laboratory
- Blower room
- Diffuser system floor plan
(2) Oxygen supply equipment
The oxygen supply equipment consists of a low-temperature liquid oxygen storage tank with a water volume of 5 cubic meters and a working pressure of 4MPa. Bath steam heating copper coil vaporizer and oxygen pressure regulating valve group, oxygen storage capacity 4000 gas NM3, maximum oxygen supply capacity 200NM3/h.
(3) Oxygen supply control equipment
The oxygen supply control is centrally operated manually on an oxygen bus. Corresponding configuration of each oxygen diffuser Separate oxygen flow meter and pressure gauge. The oxygen supply of each diffuser can be adjusted according to the respective flow rate calibrated by oxygen. Read on the meter.
(4) Oxygen supply pipeline
Due to the experimental nature of this project, rubber hoses are used as oxygen pipelines. Considering that the resistance of the hose will Larger than hard pipe, DN40 pipe diameter is used for GWQ-O2-1200, and DN25 is used for GWQ-O2-400. Pipe diameter.
In order to ensure safety, equipment (2), (3), and (4) have been strictly cleaned according to the properties of oxygen. Wash and remove fat.
(5) Equipment startup cabinet
The equipment start-up cabinet and oxygen busbar form an integral skid-mounted structure. Each diffuser can be activated independently Move.
2. Experimental analysis and data collection
Since the purpose of this test is to verify the oxygenation and oxygen transfer performance of the oxygen diffuser and the continuous Possibility of water maintenance. The data collection in this test focuses on the oxygenation volume of each diffuser and its corresponding water volume. and dissolved oxygen data. The current method of water quality data analysis remains unchanged, and no new analysis points are added. Can be used for qualitative analysis. Since the display of dissolved oxygen in the pre-exposure tank on the computer is inaccurate, the data is displayed on the side of the tank. Collected on an online dissolved oxygen meter.
3. Equipment installation
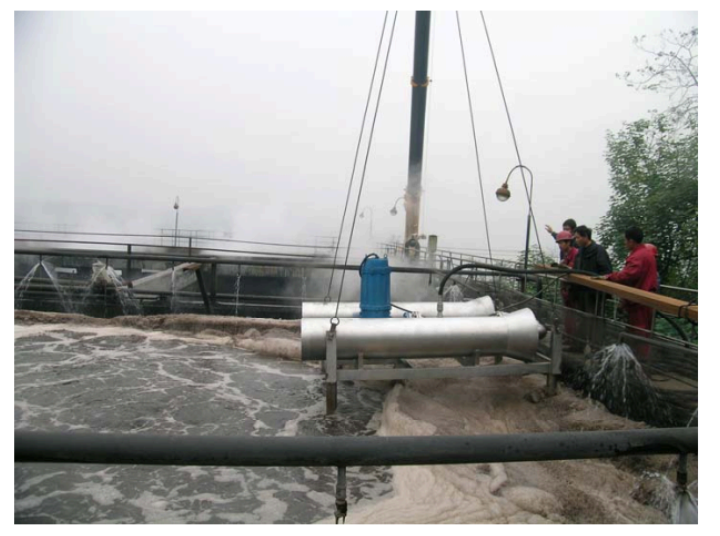
After the oxygen supply equipment, oxygen busbar and starting cabinet are in place, lay the oxygen hose and GWQ oxygen diffusion The device is hoisted into the sewage pool by a crane, and the four oxygen diffusers can be installed in place in 2 to 3 hours. See Figure 2.
The lack of aeration pipe layout data made it difficult to position the diffusers accurately for installation. During the four initial lifting operations and five subsequent lifting operations for inspection and modifications, the equipment was inadvertently lowered onto aeration pipes on two occasions. These operations confirmed that a single unit could be installed within half an hour without disrupting other equipment or the water treatment process.
4. Test process
After the equipment was installed and the air suction test run was carried out, it started at 14:00 on December 2, 2005. Pure oxygen oxygenation test. Due to the air aeration pipe being crushed during the hoisting process, it was originally expected to take 7 days of oxygenation. The oxygen supply for the performance test has been extended to December 28, 2005.
(1) Pre-exposure tank
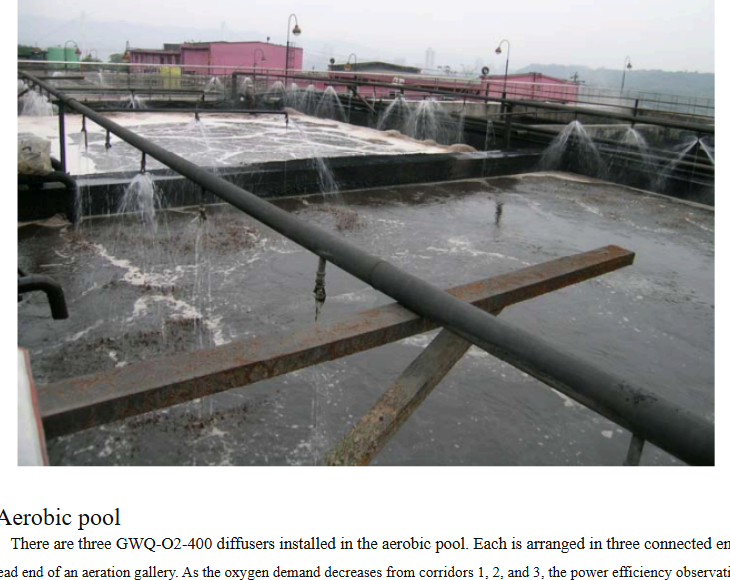
A GWQ-O2-1200 diffuser is installed in the pre-exposure tank. Observe power efficiency immediately after starting Record, when the oxygen supply is adjusted to 50M3/h (71.5kg/h), the dissolved oxygen goes from less than 0.2mg/l very quickly (5 minutes) rose to 9.3mg/l. Since the process only requires 2 mg/l of dissolved oxygen, the oxygen supply is reduced to the range of 18 to 22 M3/h. within the perimeter. The equipment ran normally without any improvements until the end of the oxygen supply test, and the average water volume processed during this period was After going through various stages of 50, 60, 90 and 130M3/h, the dissolved oxygen can always be maintained at the required 2mg/l. At the same time, it can provide a good hydraulic stirring effect, and the entire pool has less foam than an air aeration pool. See Figure 3.
(2) Aerobic pool
There are three GWQ-O2-400 diffusers installed in the aerobic pool. Each is arranged in three connected end-to-end The head end of an aeration gallery. As the oxygen demand decreases from corridors 1, 2, and 3, the power efficiency observation record Place on the diffuser in the first gallery. When three devices are running at the same time and the air supply is stopped, the first corridor The oxygen supply reading of the diffuser is 18M3/h. At this time, the water volume is 65M3/h, and the dissolved oxygen is 4.5~5.7mg/l. between.
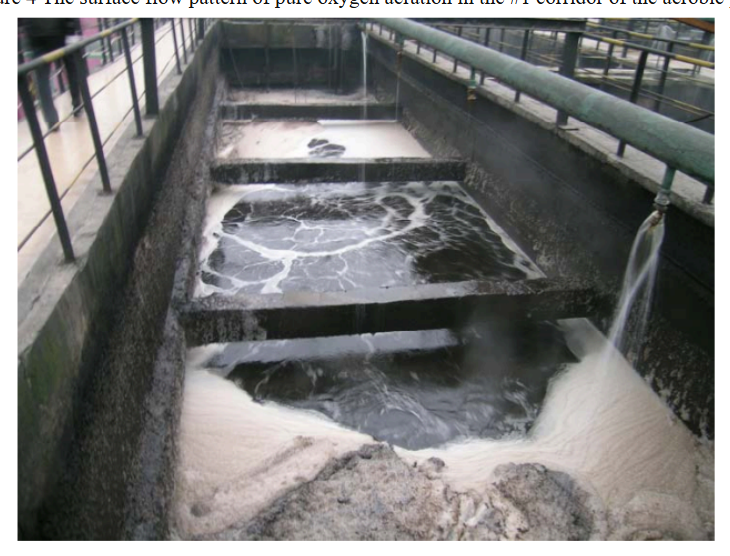
Because the aerobic pool is long (20M), the original designed efficiency nozzle cannot provide stirring effect along the entire length of the pool. As a result, during the test process, three GWQ-O2-400 diffusers were lifted out of the pool one after another to replace the synergistic nozzles. During this time, air aeration was partially turned on to provide agitation. After replacing the booster nozzle, hydraulic mixing Can reach 2 to 3 meters away from the other end of the corridor. See Figure 4.
4. Power efficiency test calculation
1. Calculation formula used
The calculation of power efficiency is based on the urban construction industry standard of the People's Republic of China "Aerator Clean Water Oxygenation Performance" Calculation according to the formula specified in "Energy Measurement" CJ/3015.2-1993. However, the calculation conditions are different from the above standards in the following ways:
●The test was conducted during the water treatment process, with new water flowing in and treated water flowing out of the pool, while the standard There is no flow in or out of the pool;
●The tested water body is coking sewage. There are problems of oxygen dissolving in the water and biochemical reactions of the sewage. The problem of determining the oxygen absorption rate OUR (OxygenUp-takingRate) in the process, while in the standard The clean water test is used, which only involves the dissolution of oxygen in water;
●Since there is no analytical means to measure OUR, the properties of sewage have an impact on oxygen transfer efficiency OTR (Oxygen TransferRate) needs to be observed experimentally;
●Due to the load changes during operation and operating regulations (DO is suitable at 2 mg/l), it cannot Increase the oxygen supply to the design point value. In fact, when the load was very low during the test, the pre-exposure The dissolved oxygen in the pool once reached 43mg/l. Therefore, we can know the oxygenation capacity of the GWQ oxygen diffuser measured during the sewage treatment process. It will be different from the value calculated based on the measurement of clean water. The specific value will be based on the nature and quantity of the sewage at the time of the test. and operating conditions. At the same time, the oxygen absorption rate OUR of sewage will affect the oxygen transfer efficiency OTR and oxygen utilization.
2. Selection of calculation model
In this test, only the data from the pre-aeration tank were used to calculate the power efficiency of oxygen transfer in sewage. The reason is Yu: The dissolved oxygen concentration in the pre-exposure tank at the beginning of the test is very low (<0.2mg/l), which can be approximated to 0, and And a piece of equipment placed in a pool just forms an independent model for calculation. The solution in the aerobic pool The dissolved oxygen concentration is high, and the three devices are placed in three connected corridors, and the dissolved oxygen measuring instrument is in the second corridor. At the end of the road, the computational model cannot be isolated.
3. Power efficiency calculation results
Take the change value of DO or C with time in the first fifteen minutes after the GWQ diffuser in the pre-exposure tank is started as shown in the table 2 shown.
| Oxygenation time (min) | Measured DO value (mg/L) |
|---|---|
| 0 | 0.15 |
| 1 | 6.21 |
| 2 | 7.36 |
| 3 | 9.1 |
| 4 | 9.2 |
| 5 | 9.3 |
| 6 | 9.4 |
| 7 | 9.5 |
| 8 | 9.4 |
| 9 | 9.3 |
| 10 | 9.3 |
| 11 | 9.3 |
| 12 | 9.3 |
| 13 | 9.3 |
| 14 | 9.2 |
| 15 | 9.2 |
The power efficiency results calculated based on the data analysis in Table 2 are shown in Table 3.
| Total oxygen transfer coefficient Kla under aerator test conditions (1/min) | 0.29 |
|---|---|
| Temperature correction coefficient Theta | 1.02 |
| DO saturation concentration (mg/L) at 20C temperature | 9.17 |
| Test temperature C | 35.00 |
| Aerator total oxygen transfer coefficient KLas (1/min) | 0.20 |
| Test water volume | 580.00 |
| Aerator oxygenation capacity qc (kg/h) | 65.12 |
| Water pump flow (m3/h) | 300.00 |
| Water pump head (m) | 15.00 |
| Bulk density of water (kg/m3) | 1.00 |
| Aerator water power NT (kw) | 12.25 |
| Aerator power efficiency (kg(O2)/kwh) | 5.31 |
| Oxygen supply pressure (MPa gauge pressure) | 0.00 |
| Oxygen supply (NM2/h) | 50.00 |
| Oxygen supply (kg/h) | 71.5 |
| oxygen utilization | 91% |
Discussion of calculation results:
1. The power efficiency of the GWQ diffuser under sewage conditions (5.31kgO2/kwh) meets the power efficiency index (4.63kg/kwh) requirements of the "Technical Agreement"
2. Because the equipment does not work under the design point conditions, its power efficiency is lower than the value under the design conditions (5.78kgO2/kwh).
3. It has been verified through experiments that even under open system conditions, the GWQ diffuser is used in coking wastewater treatment. Because the oxygen transfer rate OTR of the GWQ oxygen diffuser is very high, and because the oxygen absorption rate OUR of coking wastewater is high, a high oxygen utilization rate (≥90%) can be achieved. To achieve the purpose of economical oxygen use.
Conclusion Using GWQ oxygen diffuser secondary jet mixing technology, pure oxygen aeration is applied in the coking sewage treatment process, which can achieve the purpose of maintenance and repair without interrupting water treatment operation and greatly reduce maintenance costs. At the same time, tests have proven that the GWQ diffuser has high oxygen transfer power efficiency and oxygen utilization rate, providing equipment and technical means for economical operation of the pure oxygen aeration process.
5. Contents of qualitative observation in the experiment
Since this test was conducted during water treatment operation, there are the following restrictions:
●The amount of water entering the 1# system (air microporous aeration) and 2# system (GWQ pure oxygen aeration) is based on the water level. It is adjusted according to the quantity determined during the treatment process, not according to the same-year conditions required for the test;
●Water quality analysis has not been done at the outlet of the sedimentation tank and the anaerobic tank, and the influencing factors of the anaerobic system cannot be isolated;
●The water quality analysis time of systems 1# and 2# is not synchronized, and there is no same-year condition (same time, same load);
●MLVSS was not measured during the test. There was a value before the test, and the accuracy could not be determined;
●In the test, the MLVSS value was not increased accordingly according to the requirements of pure oxygen aeration, and the advantages of pure oxygen aeration have not been fully realized. play separately;
●After pure oxygen is used in the 2# system, the air volume of the 1# system is increased accordingly, and the amount of increase cannot be determined;
●Due to equipment improvement, part of the test time was used up. The 2# aerobic tank used complete pure oxygen aeration for a shorter time. An air agitation factor is added most of the time;
●When installing the GWQ diffuser, the air blast in the pool was not stopped. Affected by the turbulence of water and air flow, the diffuser failed to Correct positioning will affect the effect of secondary water jetting.
Under the above conditions, it is impossible to make an accurate quantitative analysis and comparison between pure oxygen aeration and air aeration, and it is impossible to give full play to the advantages of pure oxygen aeration. Nonetheless, in this experiment, some data were collected that can be analyzed qualitatively in the following aspects.
1. Can dissolved oxygen be increased based on existing air laws?
Chongqing Iron and Steel Coking Wastewater Treatment Station usually uses a 55.7M3/min, 94kw blower for oxygen aeration. The treatment water volume of a single set is 20~55m3/h (after 1:1 dilution), and the maximum is 60m3/h. The dissolved oxygen in the pre-exposure tank is usually lower than 0.2mg/l, and the dissolved oxygen in the aerobic tank is between 4 and 6.5mg/l. When the incoming water load is large, it is not easy to ensure the dissolved oxygen in the aerobic tank. In the #2 aerobic tank, the dissolved oxygen only reached 0.6mg/l.
Using the GWQ diffuser for pure oxygen aeration, the dissolved oxygen in the pre-aeration tank can reach more than 2mg/l required by the process no matter how much water is used, see Table 4. In addition, we noticed that under very high water volume conditions (91m3/h, 132m3/h), only a small amount of oxygen supply (19m3/h) can be used to achieve the purpose of dissolved oxygen greater than 2mg/l. On the one hand, this verifies the high efficiency of the diffuser, and on the other hand, it shows that the sludge concentration (MLVSS) in the water is low. Because the higher the MLVSS, the greater the oxygen demand.
The data in Table 5 were recorded when the aerobic tank completely stopped blowing and stirring. From the data in Table 5, we can see that the dissolved oxygen can still be maintained at a level that meets the process requirements (3.4mg/l~5.7mg/l) when the water volume exceeds 60m3/h. When the water volume was 91m3/h and 132m3/h, the values were invalid and not recorded because the air stirring was turned on.
From the above numerical qualitative comparison, we can know that the GWQ diffuser is used for pure oxygen aeration, which can increase the dissolved oxygen to the level required by the water treatment process.
| Record time | Treatment water volume (m3/h) | Oxygen supply volume of pre-aeration tank (m3/h) | Dissolved oxygen (mg/L) |
|---|---|---|---|
| December 2nd 16:30 | 51 | 40 | 5.7 |
| December 3rd 16:00 | 52 | 22 | 4.5 |
| December 4th 14:00 | 53 | 21 | 2.9 |
| December 6 14:00 | 56 | 23 | 3.3 |
| December 15th 16:00 | 50 | 20 | 2.8 |
| December 16 14:00 | 65 | 20 | 2.5 |
| December 16 14:00 | 76 | 21 | 2.4 |
| December 17, 9:30 | 91 | 21 | 3.1 |
| December 18, 10:00 | 132 | 20 | 2.9 |
| December 19, 8:15 | 130 | 19 | 2.3 |
| Record time | Treatment water volume (m3/h) | Aeration tank oxygen supply (m3/h) | Aeration tank oxygen supply (m3/h) | Aeration tank oxygen supply (m3/h) | Dissolved oxygen (mg/L) |
|---|---|---|---|---|---|
| Record time | Treatment water volume (m3/h) | 1 corridor | 2 corridor | 3 corridor | Dissolved oxygen (mg/L) |
| December 15th 16:00 | 50 | 23 | 23 | 10 | 4.3 |
| December 15th 17:30 | 49 | 23.5 | 23.5 | 11 | 5.7 |
| December 15th 19:00 | 61 | 20 | 20 | 8.5 | 3.6 |
| December 16, 10:00 | 63 | 20 | 19 | 8 | 5.7 |
| December 16, 11:30 | 65 | 17 | 17 | 8 | 3.8 |
| December 16 14:00 | 65 | 17 | 16 | 10 | 3.4 |
2. Can the current oxygen supply capacity of GWQ equipment meet the needs of treating the entire system’s water volume?
Comparing the oxygen supply capacity data in Table 1 with the data in Tables 4 and 5, the oxygen supply capacity abundance during the test period is obtained as shown in Table 6.
| Nameplate oxygen supply capacity kg/h | Pressurized oxygen supply capacity kg/h | Maximum oxygen supply during the test kg/h | Oxygen supply capacity kg/h | Oxygen supply capacity kg/h | |
|---|---|---|---|---|---|
| Nameplate oxygen supply capacity kg/h | Pressurized oxygen supply capacity kg/h | Maximum oxygen supply during the test kg/h | Nameplate | There is pressure | |
| P=Patm | Pg=0.5kg/cm2 | P=Patm | P=Patm | Pg=0.5kg/cm2 | |
| Pre-exposure tank | 109 | 245.25 | 72 | 38 | 174 |
| Aerobic pool | 90 | 202.5 | 83 | 7 | 120 |
Form description:
·1 standard cubic meter of oxygen = 1.43kg of oxygen
·The oxygen supply capacity on the nameplate of the GWQ diffuser refers to the oxygen supply capacity under one atmospheric pressure (Patm); ·Pressure oxygen supply refers to the oxygen supply when the gauge pressure (Pg) of the pipeline supplying oxygen to the GWQ diffuser is not zero; ·The gauge pressure of the oxygen supply pipeline during the test is Pg=0; ·The oxygen supply increases with the increase in pressure, and its magnification factor = ((gauge pressure + 1 atmosphere)/1 atmosphere) 2.
In order to analyze whether the current oxygen supply capacity of the equipment can meet the oxygen demand of the entire system, the water volume of the entire system 2×87=174m3/h was put into the 2# system for oxygen demand calculation, as shown in Tables 7 and 8.
Calculated based on the design parameters in Table 7 and Table 8, if a treatment system is used to treat the entire water volume of the coking plant, the oxygen demand in the pre-exposure tank is 105.4kg/h. Calculated based on a transfer efficiency of 70%, the oxygen supply demand is 150.5k g/h; the oxygen demand in the aerobic pool is 70.75kg/h. Calculated based on 70% transmission efficiency, the oxygen supply demand is 101kg/h, and the total oxygen supply demand is 251.5kg/h (176Nm3/h). From the data in Table 6, we can see that if the oxygen supply pressure Pg is increased to 0.5kg/cm2, the oxygen supply capacity of the pre-aeration tank can reach 245kg/h, the aerobic tank can reach 202.5kg/h, and the total oxygen supply capacity is 447.5kg/h. Even if the oxygen transfer efficiency is conservatively estimated, the current GWQ diffusion equipment can meet the oxygen supply needs of treating all sewage with one system.
| Date: | Project: Research and application of pure oxygen aeration in coking wastewater treatment system | Project: Research and application of pure oxygen aeration in coking wastewater treatment system | Project: Research and application of pure oxygen aeration in coking wastewater treatment system |
|---|---|---|---|
| Process parameters | unit | numerical value | Remarks |
| Average design flow, @ ADF | m3/day | 4176 | |
| Water ingress BOD5 @ ADF | mg/l | 2000 | COD, assuming all biodegradable |
| TKN @ ADF | mg/l | 200 | |
| TSS @ ADF | 75 | ||
| Out of water BOD5 | mg/l | 1000 | COD, assuming all biodegradable |
| TKN | mg/l | 100 | |
| design parameters | design parameters | design parameters | design parameters |
| Aeration tank volume | m3 | 599 | |
| Hydraulic Retention Time, HRT @ ADF | Days | 0.14 | |
| Mixed liquid volatile suspended solid, MLVSS | mg/l | 5000 | Assume |
| F/M vs. @ADF | Kg/Kg·d | 2.791 | BOD-MLSS load |
| Sludge productivity coefficient, Y, KgVSS/KgBOD5 | Kg/Kg | 0.7 | Typically 0.4-0.8, assuming 0.7 |
| Attenuation coefficient, Kd,d-1 | Kg/Kg·Day | 0.04 | Typically 0.04-0.075, assuming 0.04 |
| Design average biosolids residence time (sludge age) | Days | 1.0 | |
| Calculate the average residence time of biosolids,@ADF | Days | 1.0 | |
| Apparent or calculated sludge yield coefficient, VSS/#BOD5 @ADF | Kg/Kg | 0.69 | |
| Residual Sludge Discharge, @ ADF | Kg/day | 2863 | |
| BOD5 is the ratio of BOD | 0.71 | Typically 0.46-0.71, assuming 0.71 | |
| Are nitrogen removal indicators needed? | Y | 1.71 | If N is 4.57, if Y is 1.71 |
| Oxygen demand calculation | Oxygen demand calculation | Oxygen demand calculation | Oxygen demand calculation |
| Total carbon oxidation oxygen demand @ ADF | Kg/day | 1816 | |
| Nitrification Oxygen Demand @ ADF | Kg/day | 714 | |
| Total oxygen demand @ ADF | kg/day | 2530 | |
| Aeration time | hr/day | 24 | |
| Oxygen Delivery Capacity @ ADF | kg/hr | 105.41 | |
| Oxygen Absorption Rate (OUR) @ ADF | mg/l·hr | 176.1 |
| Date: | Project: Research and application of pure oxygen aeration in coking wastewater treatment system | Project: Research and application of pure oxygen aeration in coking wastewater treatment system | Project: Research and application of pure oxygen aeration in coking wastewater treatment system |
|---|---|---|---|
| Process parameters | unit | numerical value | Remarks |
| Average design flow, @ ADF | m3/day | 4176 | |
| Water ingress BOD5 @ ADF | mg/l | 500 | COD, assuming all biodegradable |
| TKN @ ADF | mg/l | 100 | |
| TSS @ ADF | 75 | ||
| Out of water BOD5 | mg/l | 100 | COD, assuming all biodegradable |
| TKN | mg/l | 15 | |
| design parameters | design parameters | design parameters | design parameters |
| Aeration tank volume | m3 | 1755 | |
| Hydraulic Retention Time, HRT @ ADF | Days | 0.42 | |
| Mixed liquid volatile suspended solid, MLVSS | mg/l | 5000 | Assume |
| F/M vs. @ADF | Kg/Kg·d | 0.238 | BOD-MLSS load |
| Sludge productivity coefficient, Y, KgVSS/KgBOD5 | Kg/Kg | 0.7 | Typically 0.4-0.8, assuming 0.7 |
| Attenuation coefficient, Kd,d-1 | Kg/Kg·Day | 0.04 | Typically 0.04-0.075, assuming 0.04 |
| Design average biosolids residence time (sludge age) | Days | 9.9 | |
| Calculate the average residence time of biosolids,@ADF | Days | 9.9 | |
| Apparent or calculated sludge yield coefficient, VSS/#BOD5 @ADF | Kg/Kg | 0.53 | |
| Residual Sludge Discharge, @ ADF | Kg/day | 888 | |
| BOD5 is the ratio of BOD | 0.71 | Typically 0.46-0.71, assuming 0.71 | |
| Are nitrogen removal indicators needed? | Y | 1.71 | If Y is 1.71, if N it is 4.57 |
| Oxygen demand calculation | Oxygen demand calculation | Oxygen demand calculation | Oxygen demand calculation |
| Total carbon oxidation oxygen demand @ ADF | Kg/day | 1091 | |
| Nitrification Oxygen Demand @ ADF | Kg/day | 607 | |
| Total oxygen demand @ ADF | kg/day | 1698 | |
| Aeration time | hr/day | 24 | |
| Oxygen Delivery Capacity @ ADF | kg/hr | 70.75 | |
| Oxygen Absorption Rate (OUR) @ ADF | mg/l·hr | 40.3 |
3. Can using GWQ oxygen diffuser for pure oxygen aeration provide operational flexibility and stability when load fluctuates? Outlet water quality?
During the test, we collected some routine operation laboratory data and listed them in Table 9 for observation and comparison. We can see the following phenomena:
●Effluent COD: Compared with the 2# (using pure oxygen) system and the 1# (using air) system, the 2# data is always better than 1 # is low (good), and the water volume of the 2# system is higher than 1# (50%) in the later stage;
●NH3-N: Whether at the inlet of the aeration tank or the outlet of the secondary sedimentation tank, the value of the 2# system is always better (lower) than 1# system, and the water volume of 2# system is higher than 1# (50%) in the later stage;
●SCN: Generally speaking, 2# is better than 1#; when the water volume is 130M3/h, stopping pure oxygen aeration will cause SCN exceed the standard;
●NO2- and NO3-: There is little difference between the 2# system and the 1# system, indicating that pure oxygen has no negative effects on nitrifying bacteria. influence. The above observation and analysis were made without improving the MLVSS according to the operating requirements of pure oxygen aeration and with insufficient laboratory data. Despite this, we can still qualitatively believe that the operational flexibility/ability to stabilize effluent water quality during load fluctuations using pure oxygen aeration is better than that of air aeration. Specific quantitative conclusions must be made through process experiments.
| time | sampling point | Water volume m3/h | COD (mg/L) | NH3-N(mg/L) | NH3-N(mg/L) | SCN-(mg/L) | SCN-(mg/L) | NO2 -(mg/L) | NO3 -(mg/L) |
|---|---|---|---|---|---|---|---|---|---|
| time | sampling point | Water volume m3/h | Secondary sedimentation tank water discharge | Aeration tank import | Secondary sedimentation tank water discharge | Regulating pool water | Water from the primary sedimentation pond | Secondary sedimentation tank water discharge | Secondary sedimentation tank water discharge |
| 12.8 | 1# | 45 | 135.74 | 25.2 | 5.6 | 15.23 | 14.58 | 11.89 | 3.01 |
| 12.8 | 2# | 45 | 19.6 | 5.6 | 8.28 | 8.88 | 2.68 | ||
| 12.9 | 1# | 55 | 33.6 | 15.4 | 4.59 | 2.46 | |||
| 12.9 | 2# | 55 | 120.41 | 28 | 8.4 | 10.2 | 3.1 | ||
| 12.10 | 1# | 51 | 50.4 | 44.8 | 15.1 | 21.15 | 1.46 | 2.31 | |
| 12.10 | 2# | 51 | 115.33 | 39.2 | 25.2 | 11.37 | 8.94 | 2.43 | |
| 12.11 | 1# | 25 | 30.8 | 16.8 | 3.26 | ||||
| 12.11 | 2# | 25 | 25.2 | 11.2 | 3.1 | ||||
| 12.12 | 1# | 25 | 44.8 | 28 | 3.76 | 2.89 | |||
| 12.12 | 2# | 25 | 29.4 | 14 | 11.56 | 2.8 | |||
| 12.13 | 1# | 25 | 42 | 28 | 28.87 | 3.62 | 3.1 | ||
| 12.13 | 2# | 40 | 25.2 | 4.2 | 11.04 | 2.34 | |||
| 12.14 | 1# | 22 | 42 | 33.6 | 7.22 | 4.11 | |||
| 12.14 | 2# | 26 | 22.4 | 8.4 | 10.55 | 2.98 | |||
| 12.15 | 1# | 40 | 144 | 56 | 30.8 | 15.64 | 6.22 | 17.94 | 4.23 |
| 12.15 | 2# | 60 | 33.6 | 8.4 | 10 | 19.22 | 3.1 | ||
| 12.16 | 1# | 41 | 129 | 21.84 | 17.03 | 3.97 | |||
| 12.16 | 2# | 62 | 8.96 | 18.74 | 3.24 |
4. Surface foam formation
Aeration using pure oxygen produced much less foam than air during most of the test period (Figure 3). We have also seen a lot of foam in a short period of time, which may be due to the water quality composition, or it may be caused by low load and too much oxygen.
On the surface of the foam, black fine granular substances have been observed adhering to the foam. Judging from the nitrification effect and NO3- value, it cannot be nitrifying bacteria. It should be that the carbon at the bottom of the pool was stirred and brought to the surface of the water body.
Conclusion of qualitative observations: Using the GWQ diffuser for pure oxygen aeration can maintain the dissolved oxygen in the water at the required level no matter how the sewage load of the Chongqing Iron and Steel Coking Plant changes. Only one system can be used to process the amount of water currently processed by the two systems, improving processing capacity and providing operational flexibility. However, whether the effluent quality standards can be met under load shock conditions needs to be verified through process tests.
b
6. Economic Comparative Analysis
Using a GWQ diffuser for pure oxygen aeration will result in an increase or decrease in related costs compared with the current use of air aeration. Based on the year-on-year conditions of reaching a water treatment capacity of 87m3/h (at this time, the air method is used to start two fans), and using Chongqing Iron and Steel Coking Plant and Chongqing Iron and Steel Group Corporation as accounting units respectively, the cost increase and decrease analysis results of using the GWQ diffuser for pure oxygen aeration are shown in Table 10 and Table 11.
| Project | air law | oxygen method | Cost increase (+)/decrease (-) |
|---|---|---|---|
| Power consumption | 812,160.00 | 192,240.00 | -619,920.00 |
| Oxygen consumption | - | 760,320.00 | 760,320.00 |
| Repair | 30,000.00 | 12,000.00 | -18,000.00 |
| defoaming water | 172,800.00 | - | -172,800.00 |
| Debugging cost after overhaul | 10,000.00 | - | -10,000.00 |
| depreciation | - | 95,000.00 | 95,000.00 |
| total cost ¥ | 1,024,960.00¥ | 1,059,560.00¥ | 34,600.00 |
| Annual water treatment volume | 689040 | 751680 | 62640 |
| unit cost | 1.49 | 1.41 | -0.078 |
※ Taking Chongqing Iron and Steel Coking as the accounting unit, due to the increase in oxygen costs and asset depreciation, the total annual cost increased by 34,600 yuan. However, because the water treatment can be repaired without stopping, the unit treatment cost is reduced by 0.078 yuan/m3.
| Project | air law | oxygen method | Cost increase (+)/decrease (-) |
|---|---|---|---|
| Power consumption | 812,160.00 | 192,240.00 | -619,920.00 |
| Oxygen consumption | - | - | - |
| Repair | 30,000.00 | 12,000.00 | -18,000.00 |
| defoaming water | 172,800.00 | - | -172,800.00 |
| Debugging cost after overhaul | 10,000.00 | - | -10,000.00 |
| depreciation | - | 95,000.00 | 95,000.00 |
| total cost ¥ | 1,024,960.00¥ | 299,240.00¥ | -725,720.00 |
| Annual water treatment volume | 689040 | 751680 | 62640 |
| unit cost | 1.49 | 0.40 | -1.089 |
Conclusion: Taking Chongqing Iron and Steel Group Corporation as the accounting unit, because the amount of oxygen required for coking pure oxygen aeration is very small (176Nm3/h), for Chongqing Iron and Steel’s air separation capacity of more than 40,000 cubic meters/hour, there will be no need to increase oxygen production due to the use of oxygen for coking sewage treatment, nor will it save any oxygen because the coking plant does not use oxygen. For Chongqing Iron and Steel Group Co., Ltd., the oxygen cost increase of using pure oxygen aeration is zero. Therefore, the annual cost dropped by 725,720 yuan, and the unit processing cost dropped by 1.09 yuan/m3. Using pure oxygen aeration, Chongqing Iron and Steel Group Co., Ltd. can better and fully utilize its existing production capacity resources, which can not only achieve environmental protection goals, but also achieve good economic benefits.
7. Suggestions
Based on the above analysis of the test technology results, especially the comparative analysis of economic costs, we believe that it is necessary to use a GWQ diffuser to conduct pure oxygen aeration process tests on coked sewage to improve water treatment capacity. The main reasons are as follows:
The sewage treatment capacity of Chongqing Iron and Steel Coking Plant will increase (15t/h) with the completion and commissioning of the new coke oven, and fluctuations in sewage volume and water quality are inevitable objective facts in the production process. Therefore, the question facing coking plants is how to minimize fluctuations while also providing the water treatment system with sufficient operational flexibility to accommodate fluctuations? Furthermore, should Chongqing Iron and Steel Group Corporation consider expanding its sewage treatment plant to increase its sewage treatment capacity? Through this test, Chongqing Iron and Steel Coking Plant has obtained another opportunity to choose, that is, to conduct a pure oxygen aeration process test to verify whether, based on the existing facilities, it can improve the sewage treatment capacity with very little investment and without a large amount of new investment? At present, the performance test of the GWQ diffuser equipment has been completed. Judging from the conclusion of the qualitative analysis of the test, it is very possible to achieve this goal, and the risk of the process test has been greatly reduced. Therefore, in order to reduce a large amount of investment in the future, it is very worthwhile to conduct process trial research with a small investment and low risk.
For process test research, based on summarizing the experience of this equipment performance test, the following specific suggestions are put forward:
●Lay permanent oxygen supply pipelines to the coking sewage treatment station to ensure continuity and low cost of oxygen supply;
●The hoses currently used for testing in the sewage treatment station are replaced with hard pipes to reduce the oxygen supply resistance;
●In order to prevent the air aeration pipe from being crushed, a support platform was installed underwater (this has been completed during the maintenance period);
●Purchase two GWQ diffusers to prevent test interruption due to equipment failure and as backup for maintenance;
●Increase analytical testing capabilities to ensure sufficient analysis point data to guide operations and provide sufficient information for experiments Quantitative analysis basis;
●During installation, when the GWQ diffuser enters water, briefly turn off the air blast to eliminate the influence of water and airflow, so that the equipment can be in place correctly;
●The test is carried out in a step-by-step manner, with the operating parameter system supporting the system; that is, the load is increased in several stages. Operating parameters are also system-related calculated/formulated according to each stage and strictly implemented.
●Conduct oxygen safety operation training for relevant operators;
8. Conclusion
In short, it is necessary to continue the pure oxygen aeration test that has been carried out, whether in terms of improving the existing sewage treatment capacity of the coking plant, improving operational flexibility, ensuring stable drainage and meeting standards, or making full use of the existing oxygen resources of Chongqing Steel Co., Ltd. to reduce operating costs and investment costs.
